all
Prometheus Grafana Victoria*

Observability and Monitoring

Less noise. More signal. Lower dependence on senior engineers.

Overview

Most companies already have monitoring, but setups generate noise, not insight.

Typical problems:

  • too many alerts, most of them are “known” and ignored
  • dashboards that look good but do not help debugging
  • missing correlation between logs, metrics, and systems
  • slow or late detection of real issues

The result is a monitoring stack that consumes engineering time and money without providing operational confidence.

This service focuses on building signal-driven monitoring that actually helps operate the system: actionable alerts, practical runbooks, and agent-assisted incident response..
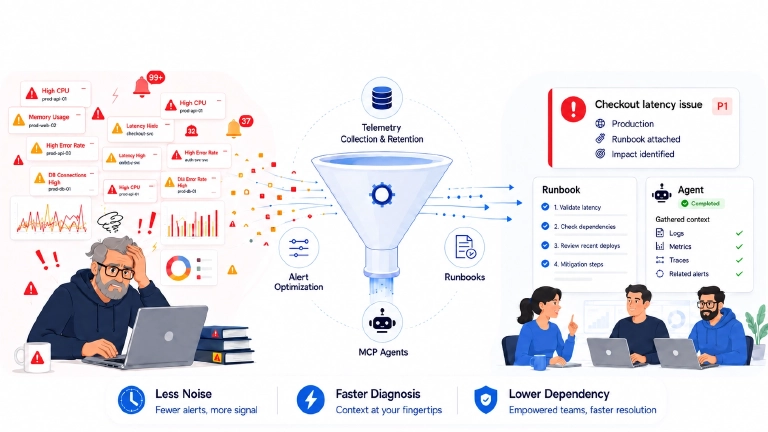
Observability illustration

Related topics

observability monitoringmonitoring setup devopsprometheus grafana setuplogging monitoringdevops monitoring services

Deliverables

  • Full stack monitoring & observability setup
  • Alerting rules & expressions
  • Runbooks, Dashboards

Outcomes

  • Your team receives fewer alerts
  • Problems are detected earlier and resolved faster
  • Routine incidents require less senior engineering time.

What gets fixed

  • Alert fatigue (too many alerts, low relevance)
  • No clear visibility into system health
  • Alerts that report symptoms without explaining impact
  • Incident response that depends on senior engineers
  • Metrics and logs retained without a clear operational purpose
  • Dashboards that show activity but do not support diagnosis

How it is done

  • Map services and critical workflows: we identify the applications, dependencies, customer-facing operations, databases, queues, background jobs, external providers, and failure points that matter to the business.

  • Audit telemetry and retention: we review which metrics, logs, and events are collected, how they are labelled, how long they are retained, what they cost, and whether engineers actually use them.

  • Remove noise: we disable or redesign obsolete, duplicated, unactionable, and overly sensitive alerts without removing meaningful monitoring coverage.

  • Strengthen important signals: we rebuild alert expressions around duration, rate of change, available capacity, service impact, dependencies, and related symptoms.

  • Add operational context: alerts receive clear ownership, severity, customer and environment labels, dashboard links, diagnostic queries, recent-change context, and runbook references.

  • Document repeatable response: we create concise runbooks for common alerts and incident types so that routine first response can be delegated safely.

  • Accelerate investigation: where useful, we implement MCP servers and agents that gather evidence, locate documentation, and prepare the first incident summary automatically.

No dashboards for the sake of dashboards.

No alerts that only transfer the diagnostic work to an engineer.

Results

  • Fewer false, duplicated, and unactionable alerts
  • Earlier detection of customer-facing failures
  • Faster confirmation that an incident is real
  • Shorter initial investigation
  • Lower mean time to detect and resolve
  • Fewer incidents escalated directly to senior engineers
  • Lower telemetry ingestion and retention costs
  • More consistent incident handling
  • Faster onboarding of support engineers
  • More applications and customers supported by the same team
  • Better use of existing monitoring tools
  • More confidence in production operations

Outcome

Monitoring should reduce the cost and complexity of operating applications.

It should detect meaningful problems, collect the right evidence, guide the engineer through the response, and reduce the amount of specialist knowledge required for production support.

Your team receives fewer alerts.

Each alert carries more useful information.

Routine incidents require less senior engineering time.

Problems are detected earlier and resolved faster.

What you get

Signal-driven monitoring

  • Alerts based on real impact, not raw metrics
  • Reduced false positives, duplicates, and alert flapping
  • Customer, project, service, and environment context included in notifications with clear escalation paths

You keep the evidence required to investigate incidents without paying to retain data nobody uses.

Strong, actionable alerts and dashboards

  • Focus on system health and critical paths
  • Designed for debugging, not presentation
  • Alert expressions that perform additional checks before notifying an engineer

Practical engineering runbooks

  • Clear explanation of what each important alert means
  • Expected customer and service impact
  • Safe diagnostic steps, commands, and queries
  • Immediate mitigation options
  • Escalation conditions
  • Recovery validation
  • Direct links to dashboards, logs, and related systems

Runbooks allow less experienced engineers to perform initial triage and standard recovery steps safely.

Typical stack

  • Prometheus / VictoriaMetrics
  • Grafana / Grafana-MCP
  • VictoriaLogs / Loki / Elasticsearch / OpenSearch / Graylog
  • VictoriaTraces / Sentry
  • Alertmanager, custom exporters, MCP-servers and agents
  • Cloud-native monitoring tools where appropriate

We work with existing tools where they are suitable.

New tooling is introduced only when it solves a clear operational problem.

Engagement format

  • Monitoring and alerting audit
  • Telemetry collection and retention design
  • Alert noise reduction
  • PromQL or MetricsQL expression optimisation
  • Alert grouping, inhibition, routing, and enrichment
  • Service-health and diagnostic dashboard design
  • Runbook development
  • Redmine or other issue-tracker integration
  • MCP server and operational agent implementation
  • Standardisation across applications and customer environments
  • Alert testing and validation
  • Ongoing monitoring-quality review

The work can optimise an existing stack or deliver the monitoring and alerting system as a complete implementation.

Request initial assessment

Tell us what hurts. We’ll fix the root cause.

  • 24–48h initial response
  • one page action plan
  • measurable outcome targets

No marketing spam. Real solutions, not rituals.